NYC TLC · 2023–2024 · quantile modeling

Rush Hour Roulette

Why a 20-minute trip sometimes becomes a 55-minute trip

Research question

Which NYC taxi routes have deceptively ordinary median travel times but unusually severe upper-tail delays, and what spatial and temporal characteristics explain that unreliability?

79,479,946raw trips
75,116,985cleaned trips
2023–2024two years of NYC TLC
5,532well-supported routes

The finding

The less reliable route is usually the faster one on a good day

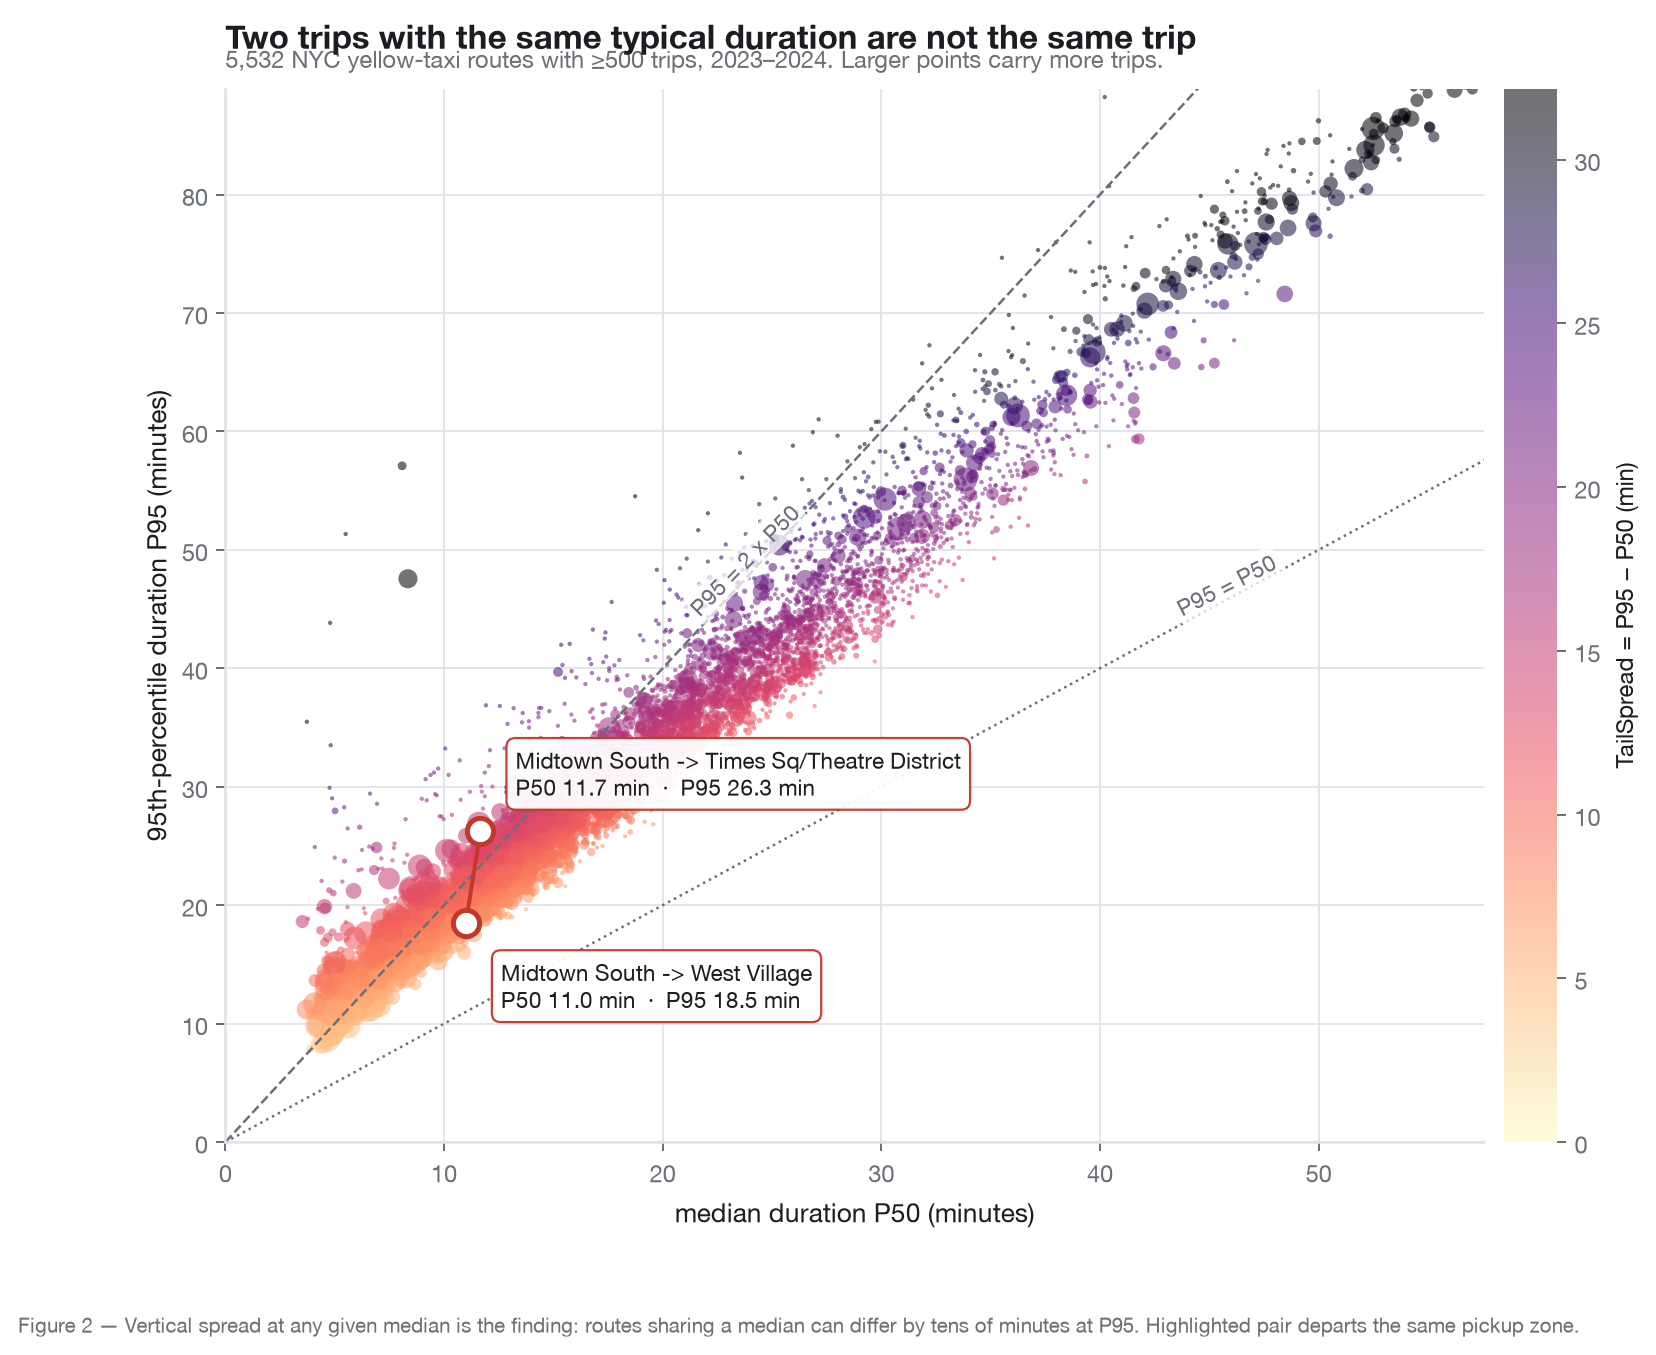
Among 3,966 well-supported route pairs whose medians agree within 10% but whose P95s differ by at least 40%, the less reliable route was faster at P10 in 82% of comparisons — and slower at P95 in 100%.

QuantileShare of pairs where the unreliable route is SLOWERMedian difference (min)
P1018.4%-0.95
P2520.8%-0.57
P5084.4%+0.67
P95100.0%+8.89
These are variance trades, not slow routes. They are better than the alternative on an ordinary day and far worse on the day you cannot afford. Median-based comparison does not merely fail to flag them — it actively selects for them. In 81% of pairs the route is faster at P10 and slower at P95.

Across the whole sample the criterion identifies 47,402 qualifying pairs spanning 1,071 distinct unreliable routes.

Example

Same pickup zone, same typical trip, different risk

More reliable
Midtown South → West Village
P50
11.0 min
P95
18.5 min
trips
36,466
Less reliable
Midtown South → Times Sq/Theatre District
P50
11.7 min
P95
26.3 min
trips
81,604

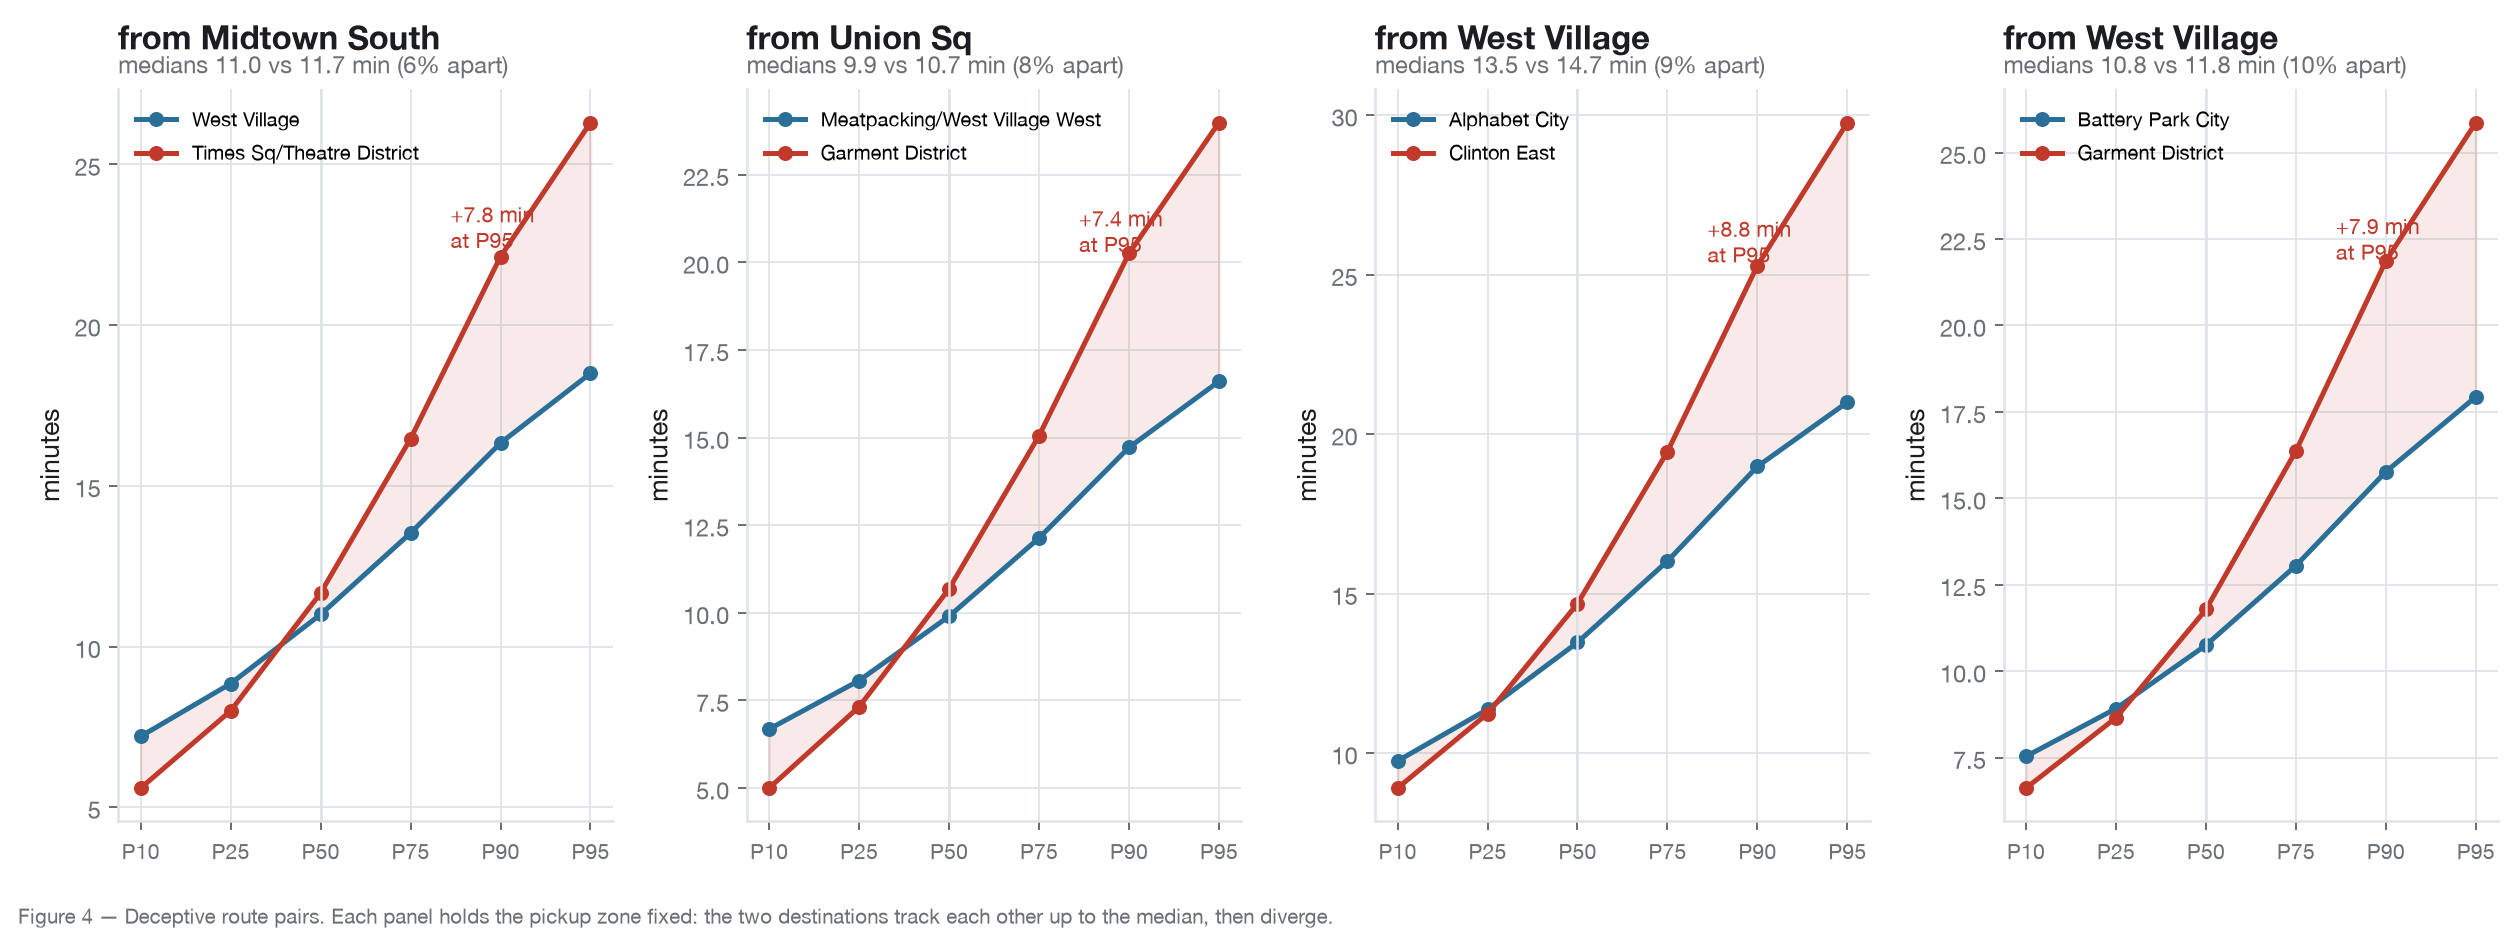
Medians 6% apart; P95s 42% apart. The 7.8 min gap is 63 standard errors wide, so it is not sampling noise.

P50 versus P95 for all 5,532 supported routes. The vertical spread at any given median is the result: if the median determined risk, this cloud would be a line.
Quantile ladders for four same-origin pairs. The two routes track each other up to the median, then diverge — and cross below it.

Time of day

Congestion moves the tail about twice as far as the centre

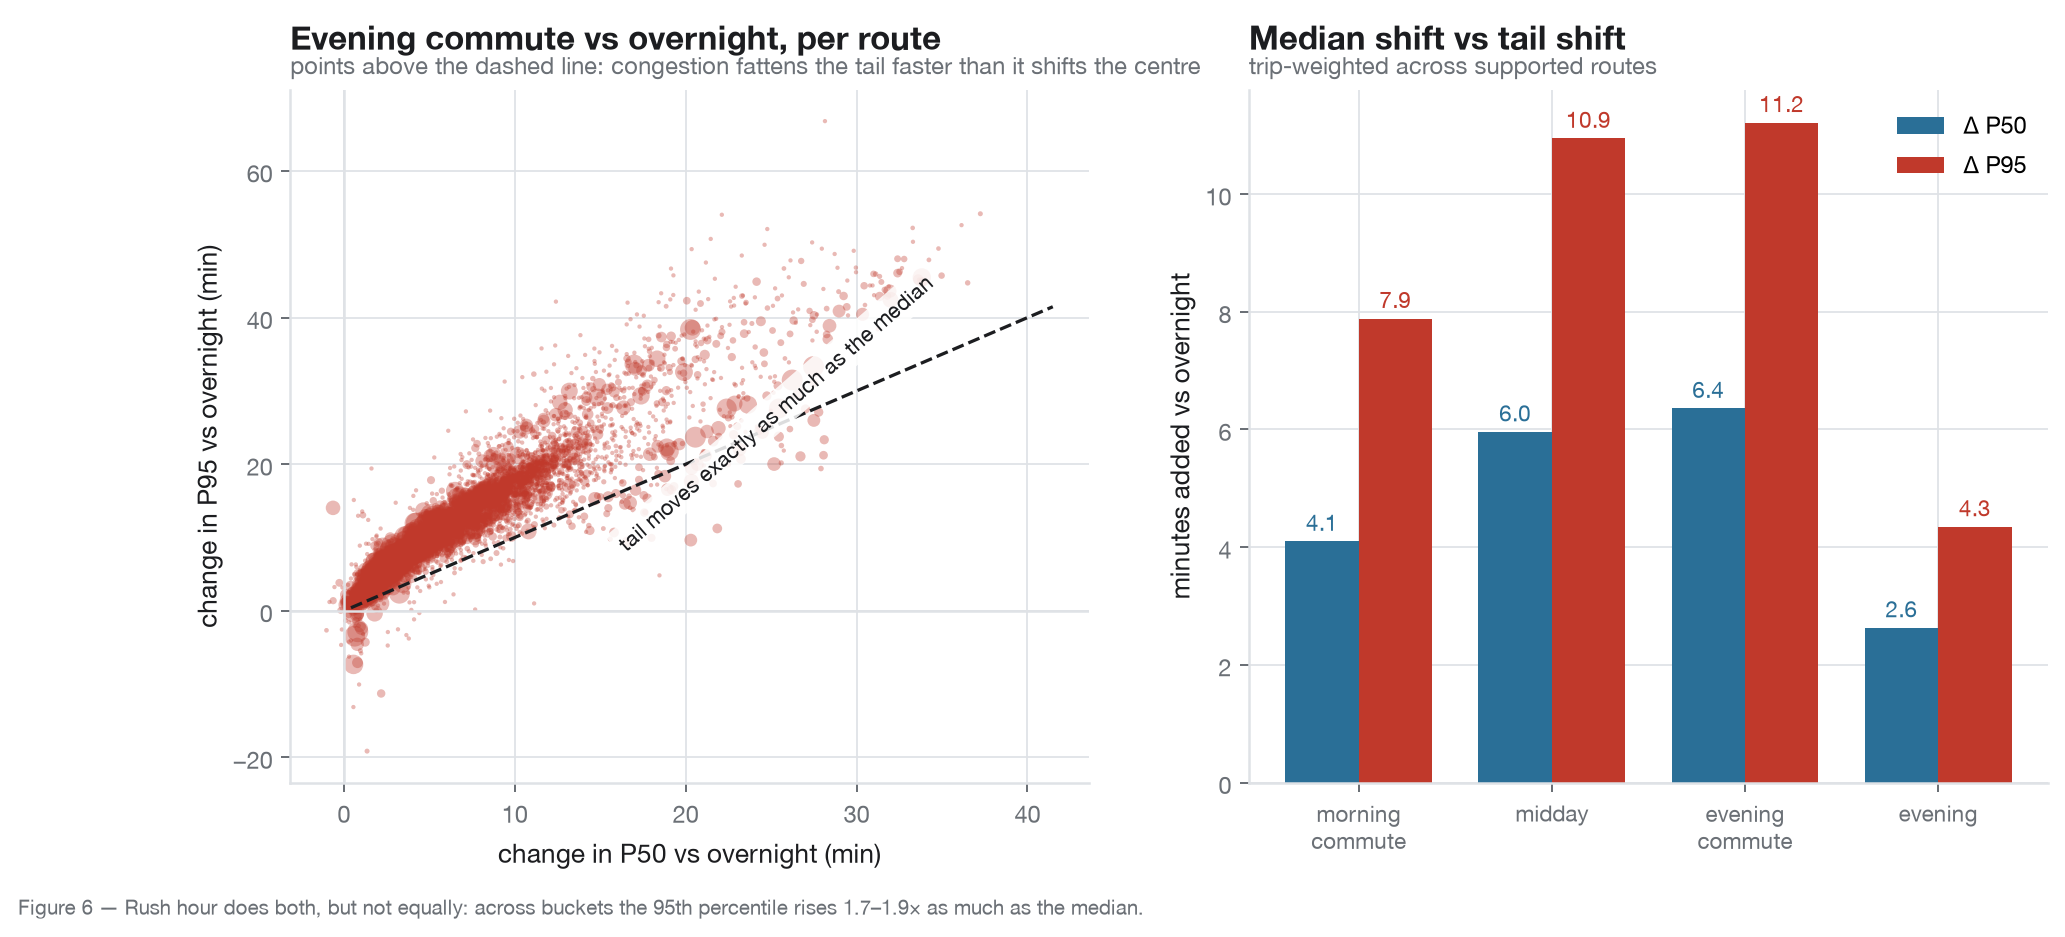
Each route is compared against its own overnight baseline. Aggregates are trip-weighted across supported routes.

BucketΔ medianΔ P95Amplification
morning commute+4.1+7.91.92×
midday+6.0+10.91.84×
evening commute+6.4+11.21.76×
evening+2.6+4.31.65×

The evening commute adds +6.4 min to the median but +11.2 min to P95 — an amplification of 1.76×. Unreliability peaks at 16:00 (TailSpread 12.3 min) and bottoms at 03:00 (5.6 min).

Left: per-route change in P50 versus P95 for the evening commute. Almost the entire cloud sits above the 45° line, so tail-stretching is close to universal rather than driven by a few extreme routes.

Correction · spatial normalisation

Absolute spread is mostly a map of trip length

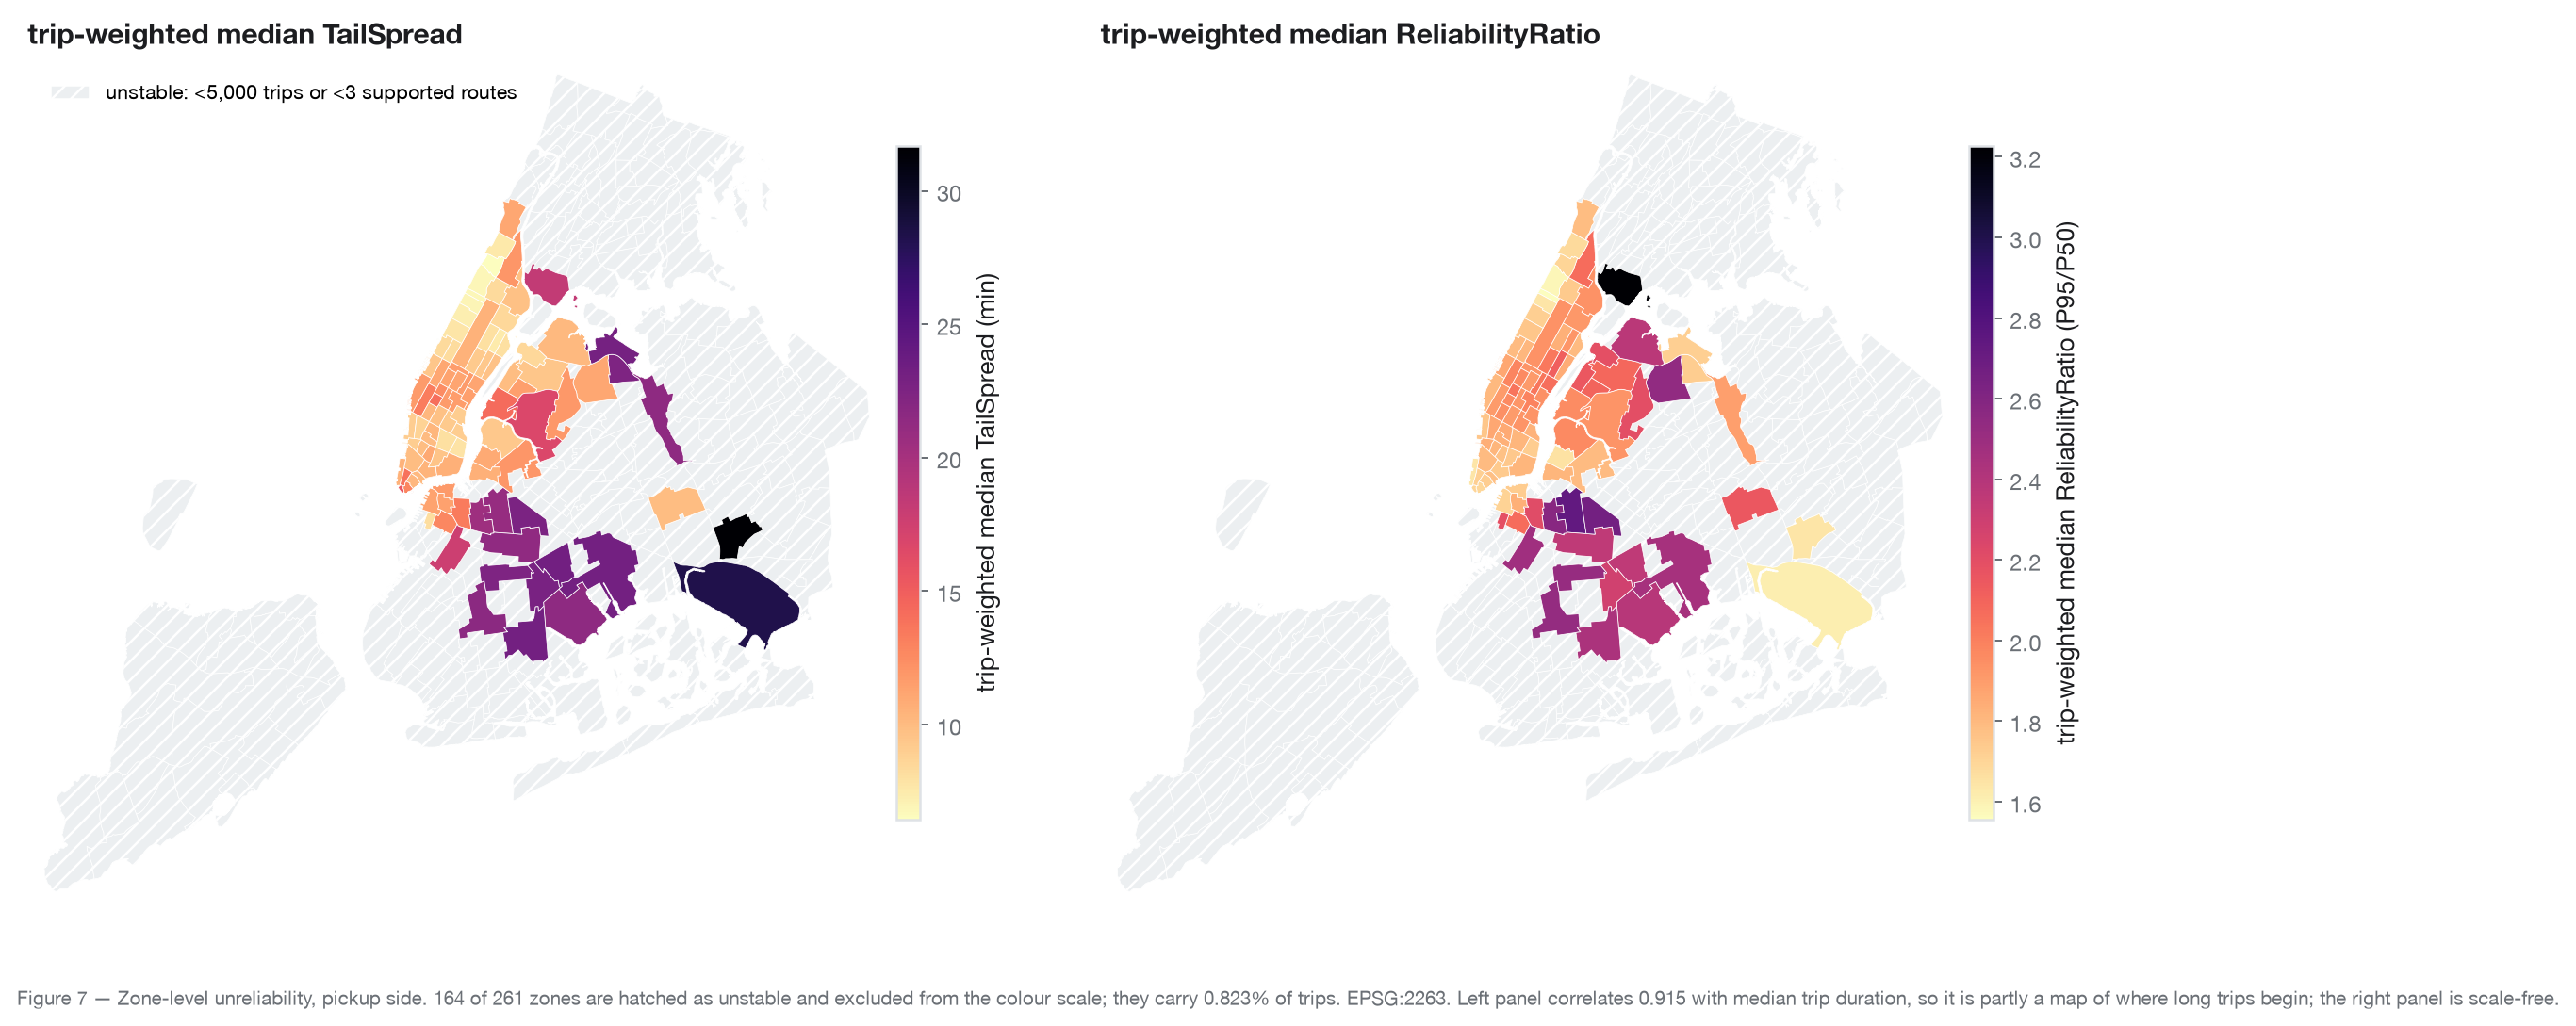
An earlier reading of this data was wrong. Across stable zones, absolute TailSpread correlates 0.92 with median trip duration. A 30-minute trip has more room to go wrong than an 8-minute one, so a TailSpread choropleth is largely a map of where long trips begin. The scale-free P95/P50 ratio correlates only 0.40 with trip length and is the defensible spatial measure.
BoroughStable zonesTripsMedian P50TailSpreadP95/P50
Manhattan5967,232,15612.49.91.83×
Queens156,680,65218.011.92.09×
Brooklyn22572,09823.419.12.32×
Bronx113,80920.018.43.23×

Ranked scale-free, the naive reading inverts: Manhattan is the most reliable borough, not a centre of unreliability. Its trips are short and its P95 is about 1.83× its median. The genuine outliers are the airports, which combine long trips with wide tails.

Only 97 of 261 zones clear the stability bar; the other 164 are drawn hatched and excluded from the colour scale. They carry just 0.82% of trips.

Left: absolute TailSpread. Right: the scale-free P95/P50 ratio. The panels deliberately disagree — that disagreement is the point. Hatched zones fall below the support threshold.

Modelling

The tail is predictable, but it moves

LightGBM and a linear quantile-regression baseline, both at q ∈ {0.50, 0.90, 0.95}, on a strictly chronological split: train 2023-01-01 → 2024-07-01 (5,000,477 rows), test 2024-07-01 → 2025-01-01 (1,998,222 rows), Bernoulli-sampled.

QuantileTargetLightGBM coverageLinear coverageLightGBM pinballLinear pinball
q = 0.550%44.69%46.47%1.732.42
q = 0.990%87.13%88.40%1.021.43
q = 0.9595%93.21%94.07%0.670.92

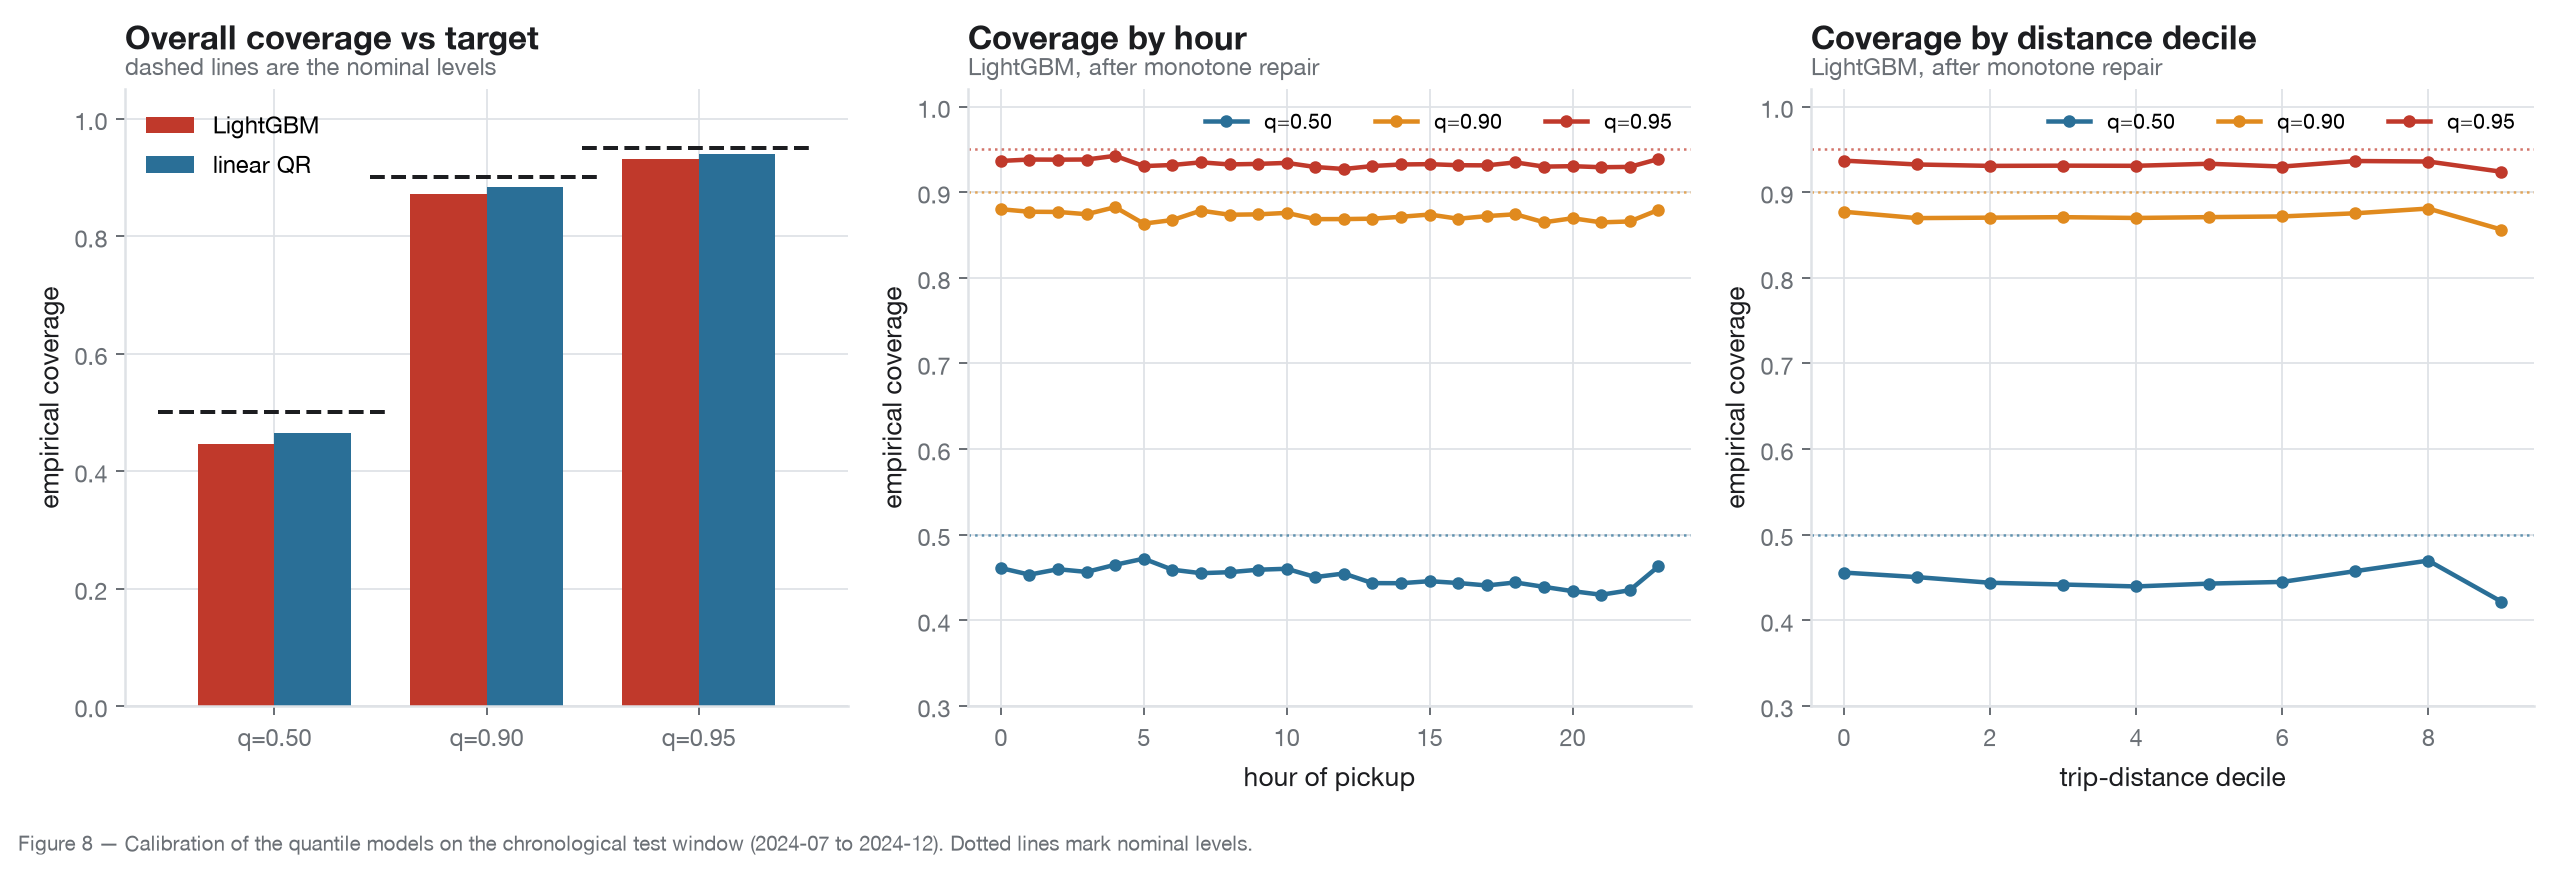
Coverage at q = 0.95 is 93.21% against a 95% target. It under-covers — the dangerous direction for a risk model — and the cause is not a mis-specified model but a moving target: the test period is genuinely slower, with P95 rising from 42.3 to 45.5 min. A random split would have hidden this entirely.

Fitting the three quantiles independently left 1.54% of rows violating Q50 ≤ Q90 ≤ Q95 (largest violation 17.9 min). Row-wise rearrangement removes all of them.

Correction · what rearrangement guarantees. Sorting predicted quantiles is weakly closer to the true monotone quantile function in any Lp norm. It is not a guarantee that each quantile's empirical pinball loss falls — on this data q = 0.95 improves while q = 0.50 moves about 1e-5 the other way. The claim worth making is that rearrangement removes every crossing at negligible cost to sharpness, not that it is free.

Distance tells you how long a trip usually takes; time tells you how badly it can go wrong. Trip distance loses 13.3 percentage points of gain share from q = 0.50 to q = 0.95 (44.9% → 31.6%), while hour-of-day features roughly double (8.4% → 15.4%).

Coverage against target overall, by hour and by distance decile. The shortfall is a uniform level shift rather than a structural failure in any slice — consistent with distribution drift, not model malfunction.

Secondary result · near-null

Rain matters far less than the hour of day

Hourly ERA5 reanalysis at Central Park, joined on local pickup date and hour (100.0% match rate). The marginal comparison is non-monotonic — moderate rain appears faster at P95 than dry conditions — which is a sign of confounding, not a result.

BandHoursTripsP50P95Δ P50Δ P95
dry14,94463,533,61013.043.00.000.00
light2,31010,371,41113.144.1+0.07+1.03
moderate2391,033,64712.942.2-0.08-0.80
heavy51178,31712.946.2-0.07+3.17

Matching within (route, time bucket) across 9,364 cells removes the composition effect and recovers a consistent but tiny effect:

Rain, median+0.11 min
Rain, P95+0.26 min
Evening commute, P95+11.2 min
Statistically overwhelming, practically negligible. The direction is consistent across 61% of cells (z = 21), so it is not chance — it is simply small: roughly 43× smaller than the evening commute. Heavy rain fell in only 51 of 17,544 observed hours, so that band is imprecisely estimated. Weather is not a headline here.

Method

Scale, cleaning and support

24 monthly TLC Parquet files are read by DuckDB directly from disk and rewritten as a ZSTD dataset partitioned by year and month (1.689 GB, 24 partitions). Nothing above 100k rows is ever loaded into pandas.

Cleaning, with accounting that closes

Raw distributions are profiled before thresholds are chosen. Rules are applied as an ordered sequence in which each rule is credited only with rows that survived every prior rule, so removals sum exactly to raw − clean. That identity is asserted at runtime.

RuleRows beforeRemoved% of remaining
complete record79,479,94600.00%
timestamp ordering79,479,94629,0790.04%
within window79,450,8671440.00%
duration bounds79,450,7231,573,3491.98%
distance bounds77,877,374918,0881.18%
speed bounds76,959,28612,5310.02%
fare bounds76,946,755916,8181.19%
valid zones76,029,937912,9481.20%

Retention: 94.51% (4 further rows dropped as exact duplicates).

Support thresholds

Route-level claims require ≥500 trips. The floor discards 46,008 thin routes at a cost of only 2.6% of trips, because NYC taxi demand is extremely concentrated. The median supported route has a TailSpread of 14.1 min and a P95/P50 ratio of 1.71×.

Engine benchmark

GROUP BY (pu_zone, do_zone) -> count, mean, P50, P95 of duration_min, median of 5 trials, each in a fresh subprocess so peak RSS is per-trial and no engine benefits from a warm cache.

Rowspandas sPolars sDuckDB spandas MBPolars MBDuckDB MB
100,0000.180s0.068s0.202s12076128
1,000,0000.297s0.076s0.207s307178169
5,000,0000.814s0.120s0.272s764588344
10,000,0001.510s0.171s0.349s1,3271,104551

At 10M rows Polars is 8.8× and DuckDB 4.3× faster than pandas, and DuckDB uses 2.4× less memory — which is why the 75M-row aggregations run on it. At 100k rows pandas actually beats DuckDB; benchmarking a single size would have produced a misleading conclusion.

Apple M4 Pro · 12 logical cores · 25.8 GB RAM · Python 3.12.13
Limitations

What this cannot tell you